Introduction
We previously get some data collected by Habitat server, but in this
post, we are using Gnuplot to plot our
data.
This is data that has been stored on the payload, not the data sent
to Habitat server during the flight.
Data sent during the flight do not contain:
- Data for every minutes of the flight
- Data about some sensors (like pressure)
To have my files in the same time zone as Habitat, I subtracted 1 hour
with date command as bellow:
$ for i in `cat toto | awk '{print $1}'`; do date -d "$i 1 hour ago" | awk '{print $4}' >> tutu; done
Use of gnuplot
Gnuplot can be installed on Debian with apt-get install gnuplot.
Example of commands used to create the graph.
gnuplot> set title "Altitude"
gnuplot> unset key
gnuplot> set xlabel 'Hour'
gnuplot> set ylabel 'Altitude'
gnuplot> set grid
gnuplot> set xdata time
gnuplot> set timefmt '%H:%M:%S'
gnuplot> set format x '%H:%M'
gnuplot> plot 'altitude_data_UTC.txt' using 1:2 w lp
...
gnuplot> set y2tics
gnuplot> plot 'altitude_data_UTC.txt' using 1:2 w l, 'pression_data_UTC.txt' using 1:2 w l axes x1y2
...
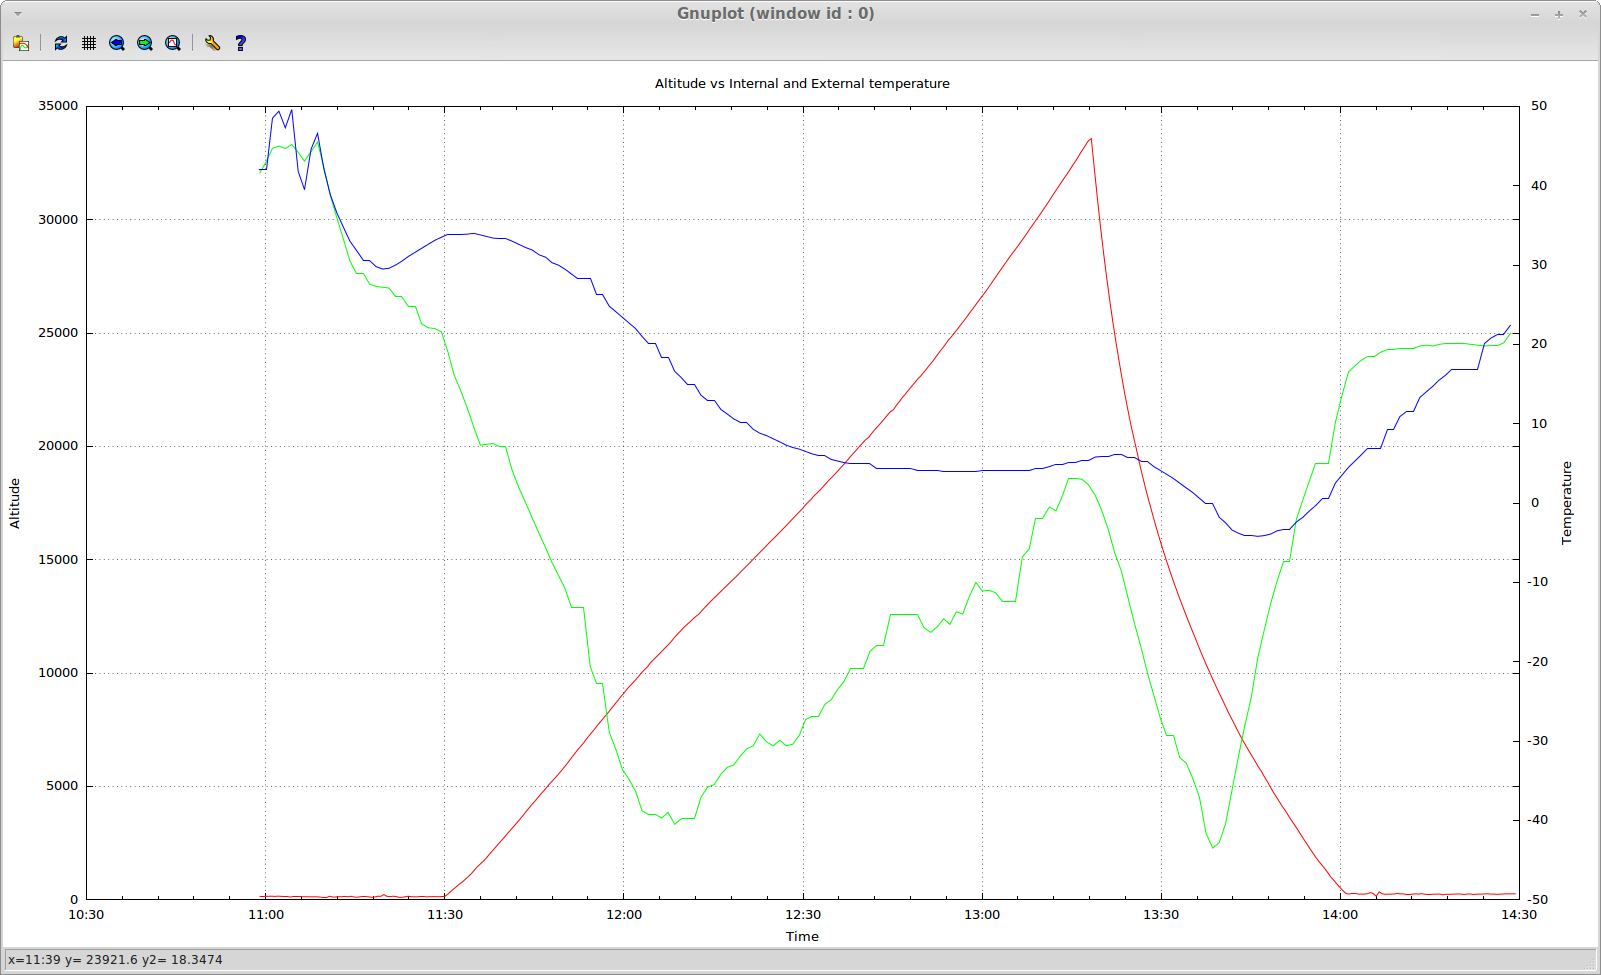
gnuplot> plot 'altitude_data_UTC.txt' using 1:2 w l, 'temperature_data_UTC.txt' using 1:3 w l axes x1y2 ,'temperature_data_UTC.txt' using 1:2 w l axes x1y2
gnuplot>
The graph created is similar to previous graphs from x-f.lv
UGGY Payload data
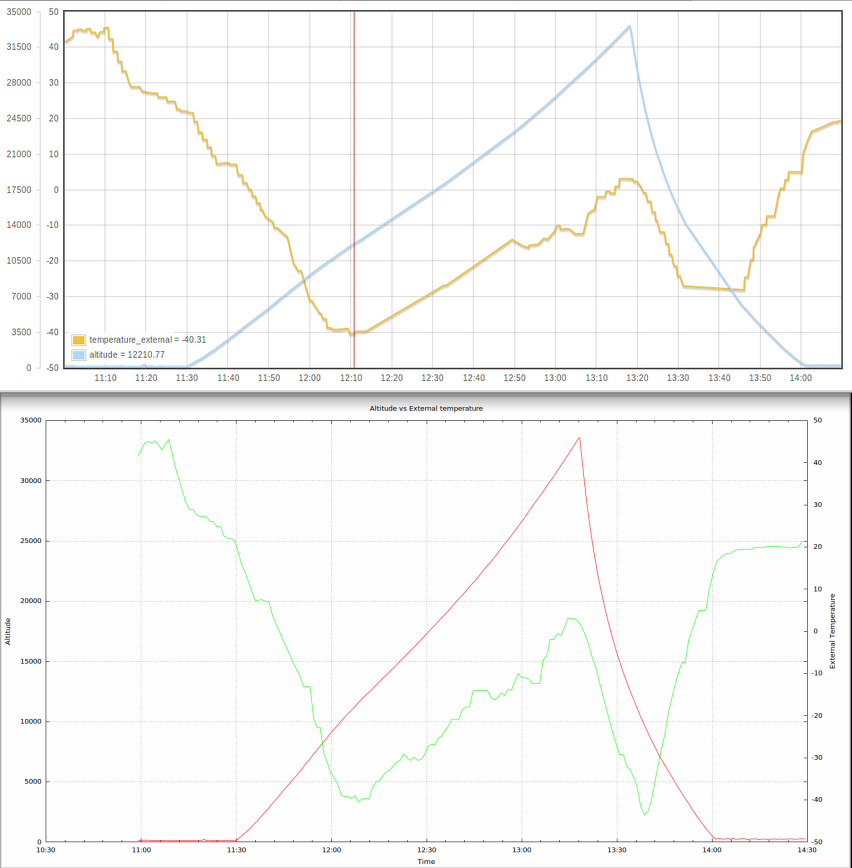
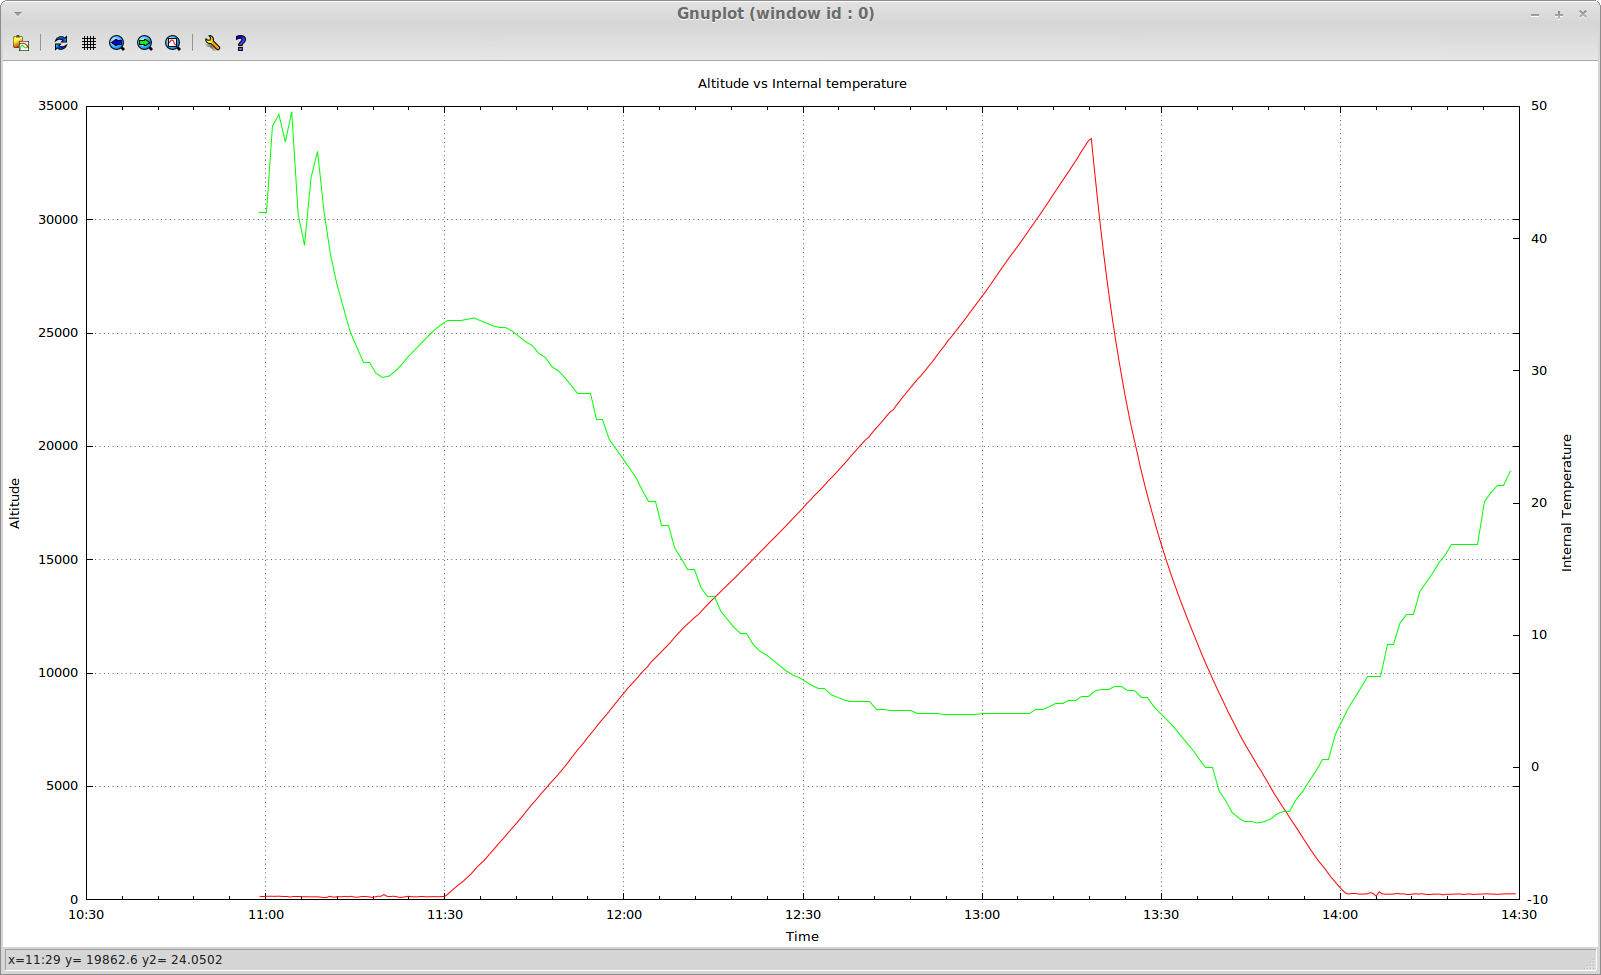
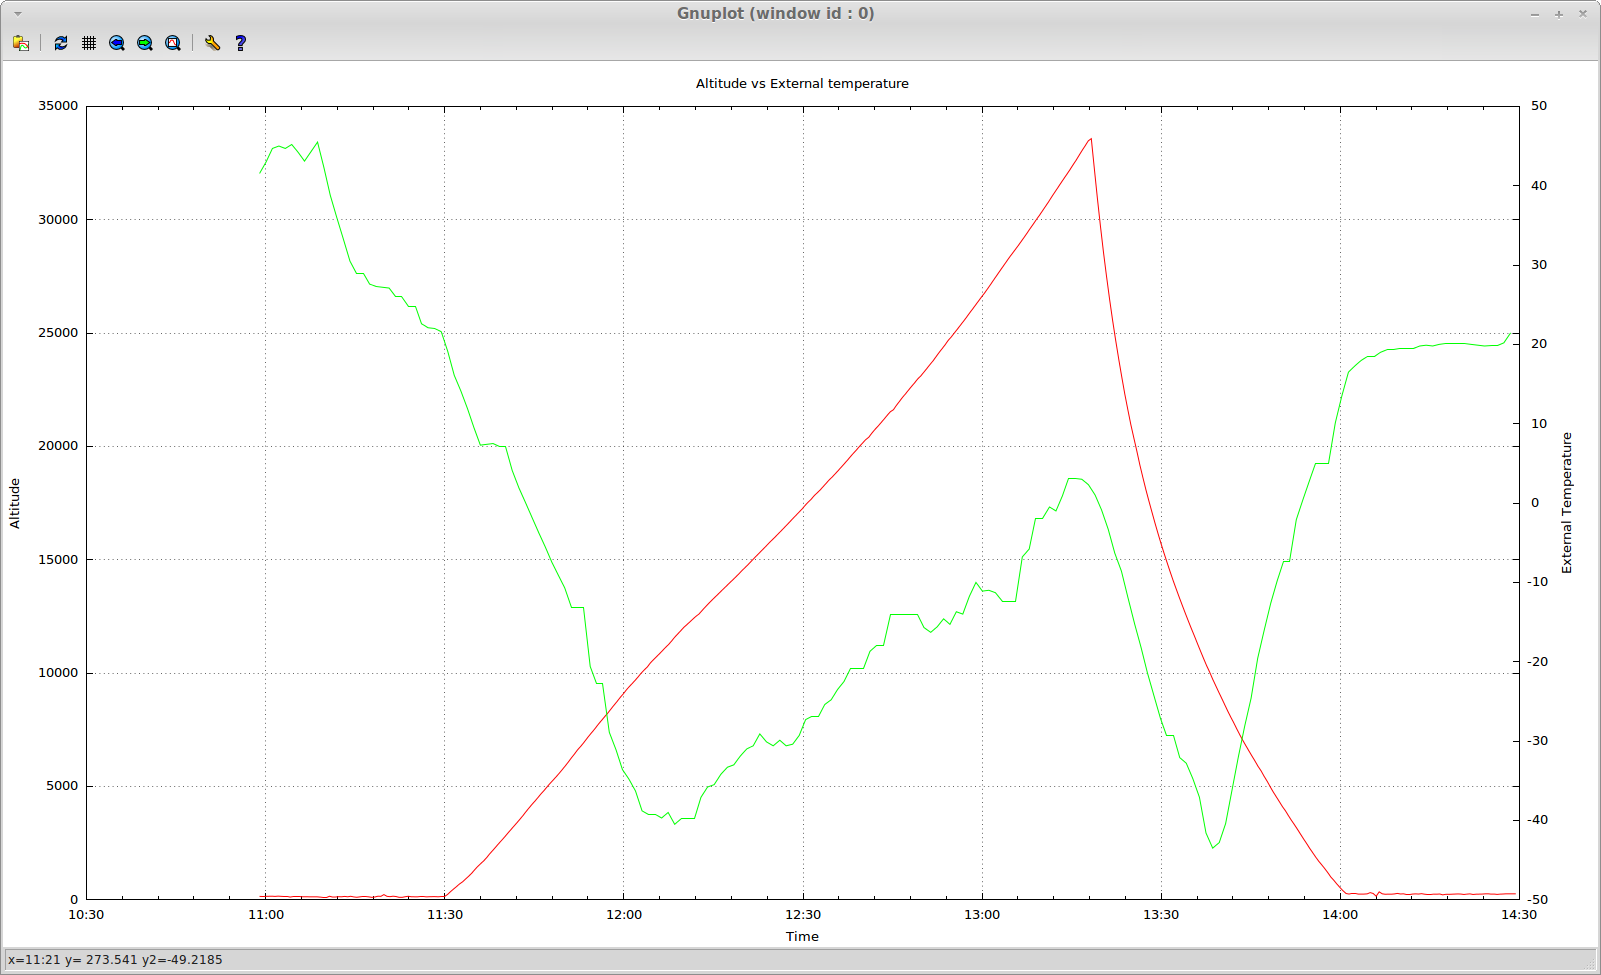
Temperature vs altitude
2 DS18B20 sensors were used (Internal + External)
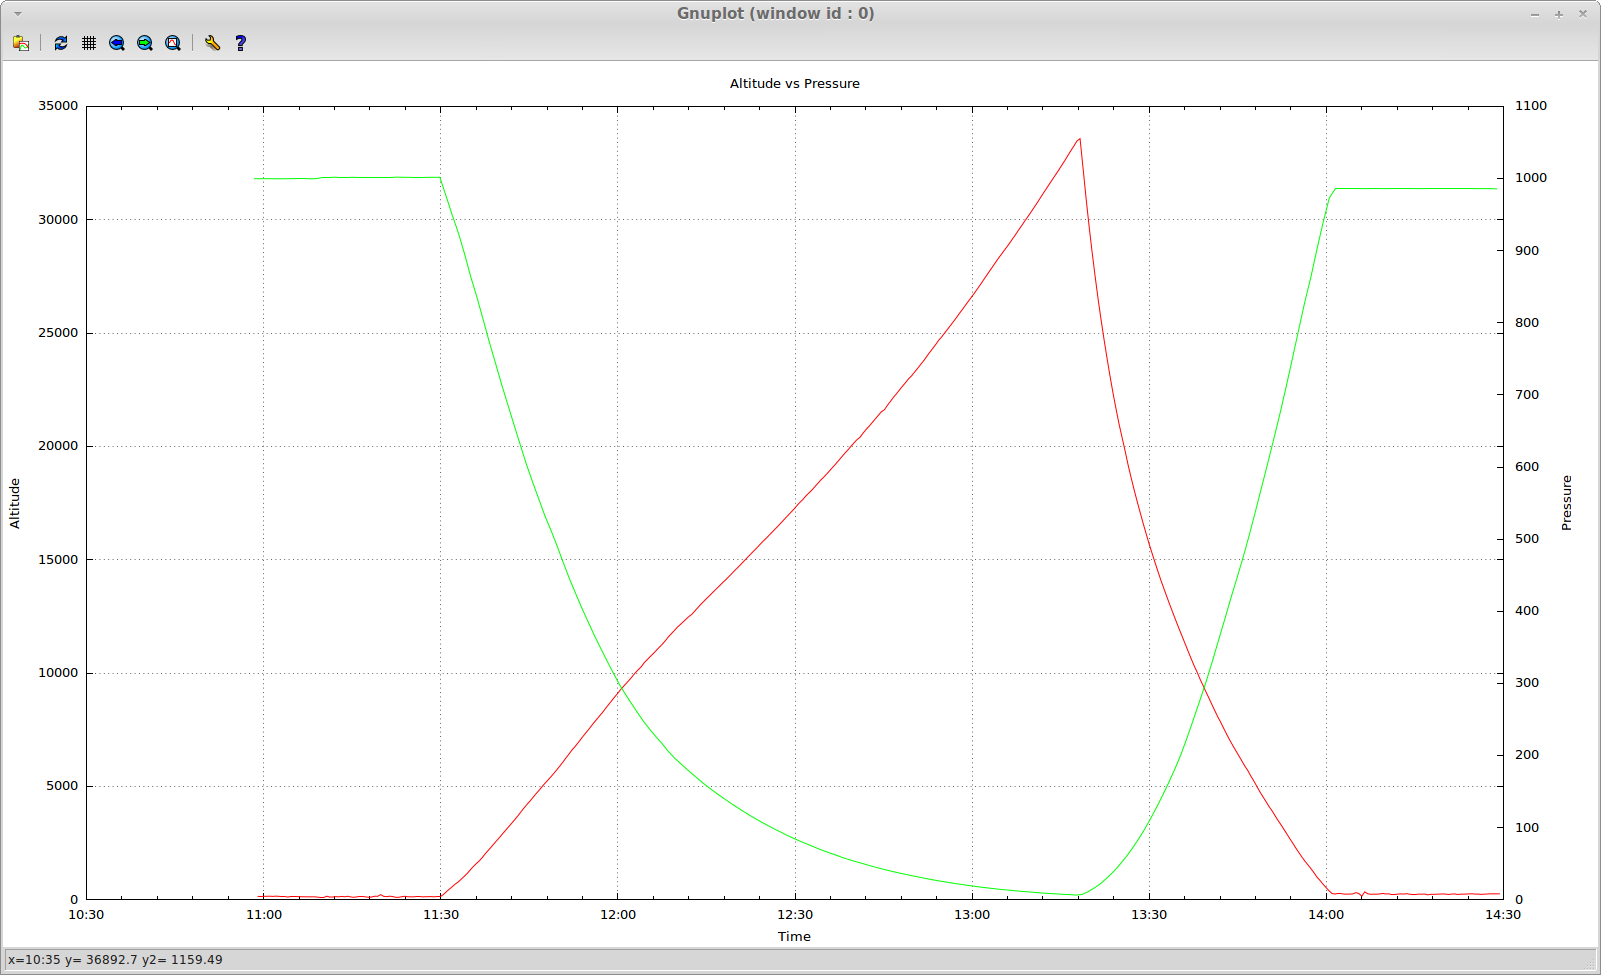
Pressure vs altitude
BMP085 was used.
It is rated as:
Pressure range: 300…1100hPa (+9000m…-500m above sea level)
So.. I was expecting nothing below 300 hPa… but strangely I get something that makes sense up to 34Km… :)
Altitude plotted is from the GPS receiver. (NOT a guess from the BMP085
calculated pressure)